


Mineral Deposits » Country Gold Reserves
MineFund.com maintains a database of projects reporting gold or gold equivalent reserves that meet JORC, NI 43-101, SAMREC or SME standards. The database represents declared reserves of ~1.2 billion ounces representing an estimated 94-7% of all known gold reserves.
Understanding mineral resources and reserves
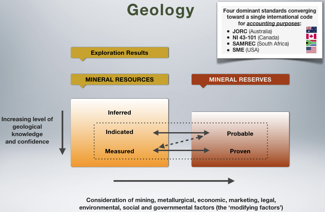
Mineral resources are classified according to a level of geological knowledge and confidence. They ascend in importance from inferred resources, to indicated resources, to measured resources. Click the image at left for a simple illustration.
Proven and probable reserves are declared when modifying factors (mining, metallurgical, economic, social, marketing, legal, environmental, governmental) are applied to a project, and from which it can be determined that the minerals are capable of being extracted for a profit.
For an overview of basic mineral economics for investors, please see my presentation from a recent workshop.
Reported Gold Reserves by Country2009-2010 Reported Reserves. Selected projects. See maps below.
Richest Gold Deposits | Largest Gold Deposits | Highest Grade Gold Deposits | Company Gold Reserves | Gold Deposits by Country
| Deposit Country | # Deposits | P&P; (Moz) | P&P; Tonnes | P&P; Grade (g/t) | Avg ounces | % of Total | Cumulative % |
|---|---|---|---|---|---|---|---|
| South Africa | 42 | 155.35 | 1595 | 5.76 | 3.70 | 14% | 14% |
| Australia | 32 | 128.98 | 3943 | 3.55 | 4.03 | 12% | 26% |
| Russia | 26 | 126.97 | 2399 | 3.45 | 4.88 | 11% | 37% |
| Canada | 28 | 106.38 | 3586 | 4.72 | 3.80 | 10% | 46% |
| United States | 28 | 96.37 | 3525 | 4.67 | 3.44 | 9% | 55% |
| Uzbekistan | 2 | 51.55 | 637 | 5.29 | 25.77 | 5% | 60% |
| Mexico | 17 | 46.58 | 2353 | 1.59 | 2.74 | 4% | 64% |
| Ghana | 12 | 41.77 | 614 | 2.20 | 3.48 | 4% | 68% |
| Chile | 7 | 34.99 | 1212 | 1.38 | 5.00 | 3% | 71% |
| Indonesia | 4 | 34.40 | 3043 | 0.72 | 8.60 | 3% | 74% |
| Brasil | 16 | 33.09 | 2037 | 2.93 | 2.07 | 3% | 77% |
| Papua New Guinea | 5 | 31.94 | 411 | 1.88 | 6.39 | 3% | 80% |
| PNG | 2 | 27.09 | 947 | 0.90 | 13.55 | 2% | 82% |
| Peru | 9 | 20.85 | 737 | 9.08 | 2.32 | 2% | 84% |
| Turkey | 4 | 14.50 | 554 | 3.04 | 3.63 | 1% | 85% |
| Argentina | 5 | 14.26 | 1112 | 2.72 | 2.85 | 1% | 87% |
| Mali | 6 | 13.63 | 131 | 2.95 | 2.27 | 1% | 88% |
| Mongolia | 1 | 13.12 | 1393 | 0.37 | 13.12 | 1% | 89% |
| Romania | 1 | 10.08 | 215 | 1.46 | 10.08 | 1% | 90% |
| D.R. Congo | 3 | 9.61 | 127 | 2.66 | 3.20 | 1% | 91% |
| Dom. Rep. | 1 | 9.46 | 102 | 2.89 | 9.46 | 1% | 92% |
| Kazakhstan | 5 | 9.05 | 127 | 2.13 | 1.81 | 1% | 92% |
| Greece | 2 | 8.19 | 164 | 1.98 | 4.09 | 1% | 93% |
| Guinea | 4 | 7.94 | 194 | 3.09 | 1.98 | 1% | 94% |
| Mauritania | 1 | 7.56 | 129 | 1.82 | 7.56 | 1% | 95% |
| China | 6 | 7.53 | 196 | 3.37 | 1.26 | 1% | 95% |
| Egypt | 1 | 7.13 | 159 | 1.39 | 7.13 | 1% | 96% |
| Ecuador | 1 | 6.78 | 26 | 8.07 | 6.78 | 1% | 97% |
| Burkina Faso | 5 | 6.41 | 129 | 2.16 | 1.28 | 1% | 97% |
| Suriname | 1 | 5.89 | 172 | 1.10 | 5.89 | 1% | 98% |
| Tanzania | 3 | 5.56 | 55 | 4.31 | 1.85 | 0% | 98% |
| Finland | 4 | 4.91 | 59 | 4.87 | 1.23 | 0% | 99% |
| C�te D'Ivoire | 2 | 3.71 | 39 | 2.67 | 1.86 | 0% | 99% |
| Philippines | 2 | 3.63 | 72 | 1.57 | 1.82 | 0% | 99% |
| New Zealand | 3 | 2.40 | 49 | 2.37 | 0.80 | 0% | 99% |
| Singapore | 1 | 1.56 | 11 | 4.62 | 1.56 | 0% | 100% |
| Guatemala | 1 | 1.53 | 9 | 5.17 | 1.53 | 0% | 100% |
| Namibia | 1 | 1.34 | 42 | 1.20 | 1.34 | 0% | 100% |
| Fiji | 1 | 0.68 | 2 | 10.90 | 0.68 | 0% | 100% |
| Nigeria | 1 | 0.53 | 9 | 1.92 | 0.53 | 0% | 100% |
| Malaysia | 1 | 0.30 | 3 | 3.13 | 0.30 | 0% | 100% |
| Botswana | 1 | 0.13 | 2 | 1.75 | 0.13 | 0% | 100% |
© Copyright 2010-2012, MineFund & Alpha Found, LLC.
Although every care has been taken to ensure that this data is accurate, MineFund cannot accept responsibility for sourcing variances, mistakes, errors or omissions or for any action taken in reliance thereon. Use of this data is governed by MineFund's Terms of Conditions.
Notes:
- Reserves are reported at 100% of the total, not the owner's attributable portion.
- Tonnages are in metric millions.
 XML error: Invalid document end at line 12